がちゃぴん先生、なにものなんだろうw

\ビルド中/
$ git checkout master
$ git fetch upstream
$ git rebase upstream/master
$ git push
$ git branch
$ git checkout zunda-ninja-master-on-heroku
$ git merge v1.4rc6
3fa8512474137e84cfaf37682e78a84995e5c862
$ git push
Slug sizeぎりぎりアウト
-----> Compressing...
Done: 308M
-----> Launching...
! Warning: Your slug size exceeds our soft limit (307 MB) which may affect boot time.
Released v52
Merged v1.4rc6 and running smooth :)
3fa8512474137e84cfaf37682e78a84995e5c862
> Release is tomorrow morning
どこタイムゾーンてか誰タイムゾーン?
$ heroku pg:info DATABASE_URL
=== DATABASE_URL, PG_HOBBY_BASIC_URL
Plan: Hobby-basic
Status: Available
Connections: 8/20
PG Version: 9.6.1
Created: 2017-04-20 18:31 UTC
Data Size: 69.6 MB
Tables: 29
Rows: 83104/10000000 (In compliance)
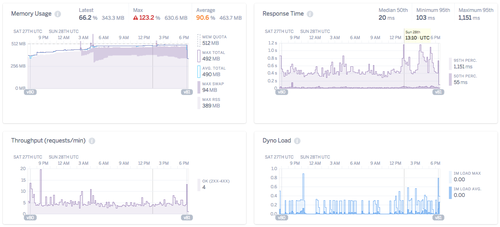
This instance showed elevated response time for a while. What was happening? Might ImageMagick have used too much swap? https://mastodon.zunda.ninja/media/G6BIkhrj7vFa9mTV4-o
Merged v1.4.1. Congratulations for the release!
8963f8c3c2630bfcc377a5ca0513eef5a6b2a4bc

そうか飛行機に乗るときは電話にUSBでHHKBつなげば作文できるのか(何を書く気だ)
The spike in swap shows ImageMagick worked hard and the spike in cache shows the instance got a media file. I'm still wondering what makes response time higher, possible with higher CPU load. https://mastodon.zunda.ninja/media/LKsykGPpSKKEgGV-5n4

$ heroku pg:info DATABASE_URL
=== DATABASE_URL, PG_HOBBY_BASIC_URL
Plan: Hobby-basic
Status: Available
Connections: 8/20
PG Version: 9.6.1
Created: 2017-04-20 18:31 UTC
Data Size: 70.2 MB
Tables: 29
Rows: 87186/10000000 (In compliance)